Predict Prospective Student Graduate Admission into University
Date: 15 Nov 2020 Tag(s): Jupyter Notebook, Pandas, Profiling, Python, College/University, Models, PCA, Hyperparameter Categories: Machine Learning, ML, Regression Download Project: 8.78 MB - Zip ArchiveOverview #
There are a lot of universities that offer the same graduate program but it can be difficult for prospective students to determine which university program they would most likely be admitted into. A prospective student being able to determine which university they would most likely be admitted into (given their scores) would save them both time from filling and sending out applications and money, since there is usually a cost/fee associated with putting in an application to the university itself.
This project compares the performance of different types regression models (Linear Regression, Random Forest, K-Nearest Neighbor -KNN- and Decision Tree) with and without using feature reduction methods (PCA) to see if it helps improve model training and/or performance results.
The notebook explores several different types of regression models (see above), along with exploring different feature reduction methods (Principal Component Analysis -PCA- and SelectKBest) to see if they can improve modeling time and/or results.
View Jupyter Notebook #
The notebook goes step-by-step through the project, please follow the directions and cell order if you would like to replicate the results.
- Click the "View Notebook" button to open the rendered notebook in a new tab
- Click the "GitHub" button to view the project in the GitHub portfolio repo
Methodology #
Each model type (Linear Regression, Random Forest, K-Nearest Neighbor, and Decision Tree) will be trained and have their hyperparameters fine-tuned with and without using PCA feature reduction. The idea being to see if the feature reduction will actually help improve the model performance over a model without feature reduction, along with trying to predict the chances of a prospective graduate student being admitted into a university graduate program.
Pandas Profiling was also used to profile the dataset to get an overview of what it looks like and adjust any of my planned analysis if necessary.
Variable Histograms #
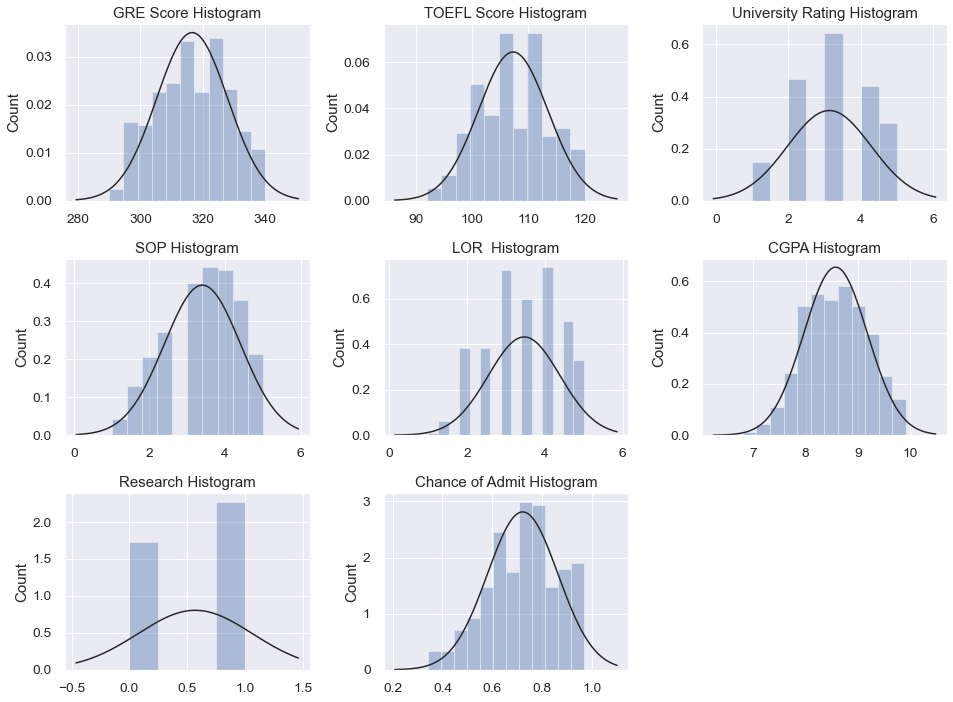
Histograms of the numerical variables to see their overall distributions in the dataset:
Correlation Matrix #
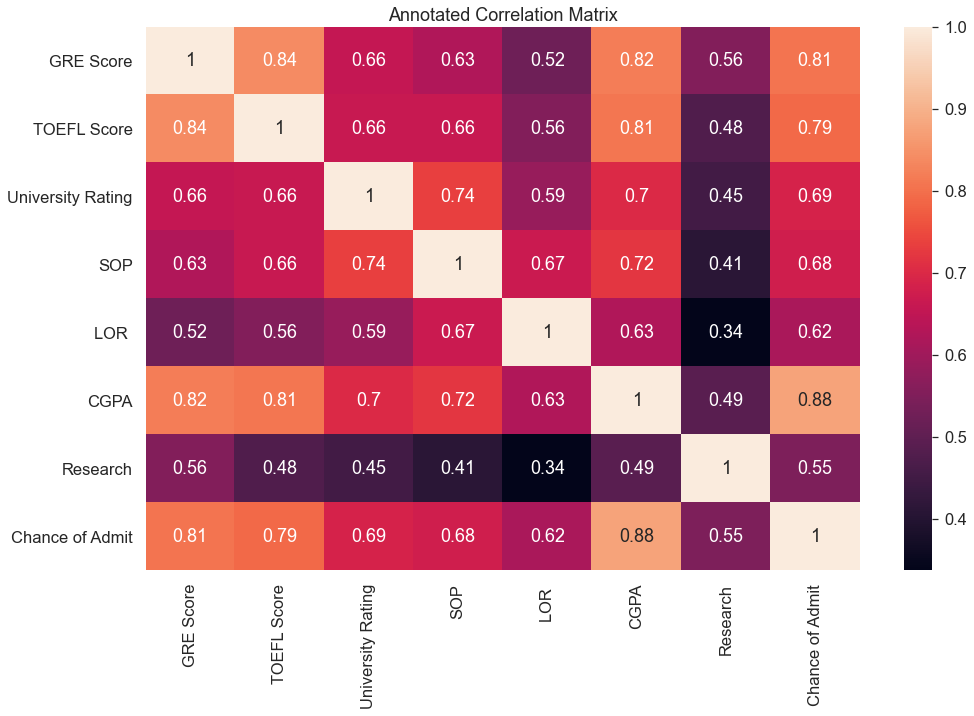
Using a correlation matrix, we see which variables have a strong correlation towards the target variable, Chance of Admit,
and other variables in the dataset. From the matrix below, we can see that there are some strong correlations between
several variables: Chance of Admit and CGPA, CGPA and GRE Score, TOEFL Score and GRE Score, TOEFL and Chance of Admit.
Parallel Coordinates #
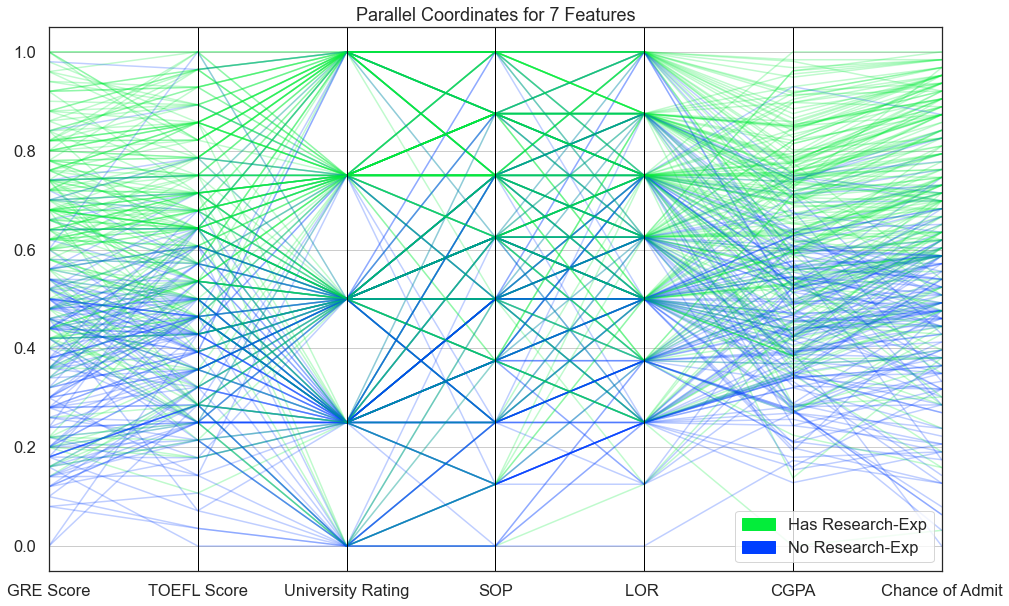
From the Parallel Coordinate graph below, we can see that (overall) prospective students that had research experience had higher scores in each variable category (including admission chance) than those that did not have any research experience.
Thus, judging from the graph above, it is evident that students that have research experience are generally perceived to be better performers academically and have higher chances of being admitted into their graduate program.
Feature Reduction #
I took a look at two different feature reduction methods: Principal Component Analysis (PCA) and SelectKBest. I ended up deciding to use PCA for the comparison of the models without feature reduction, there is no real reasoning for this choice other than it’s just the feature reduction method I wanted to explore.
My prediction at this point in the project was that because my dataset is so small, with already few variables, that there is not a large enough benefit to warrant the utilization of feature reduction techniques, let alone PCA. We shall if I was right in my final results.
Principal Component Analysis (PCA) #
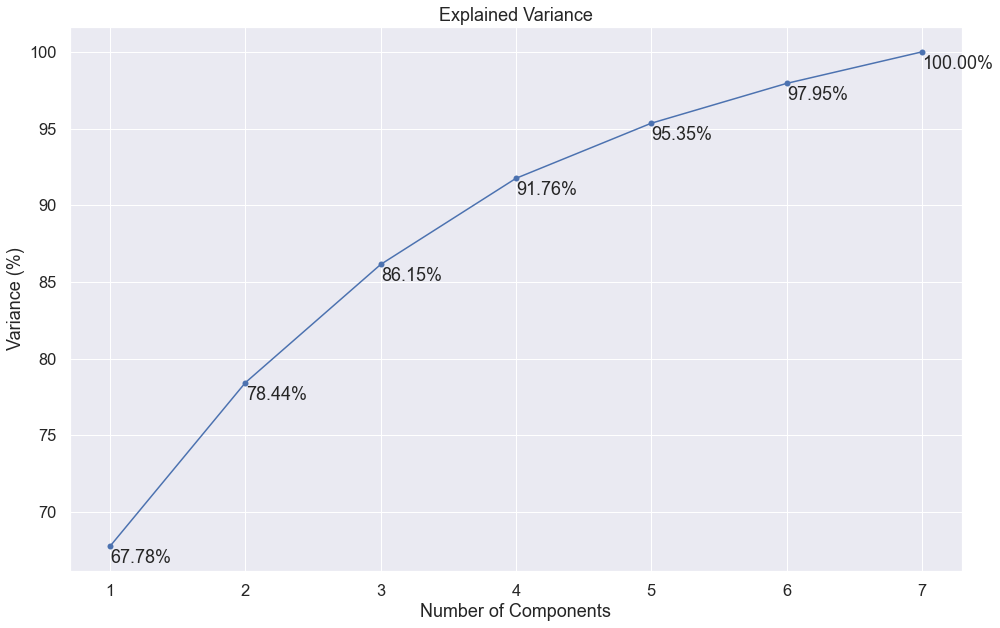
Looking at the graph below, we can see that the first 5-6 components explains roughly 95-98% of the dataset, thus I
decided to use 5 components for the number of component reductions for PCA.
SelectKBest #
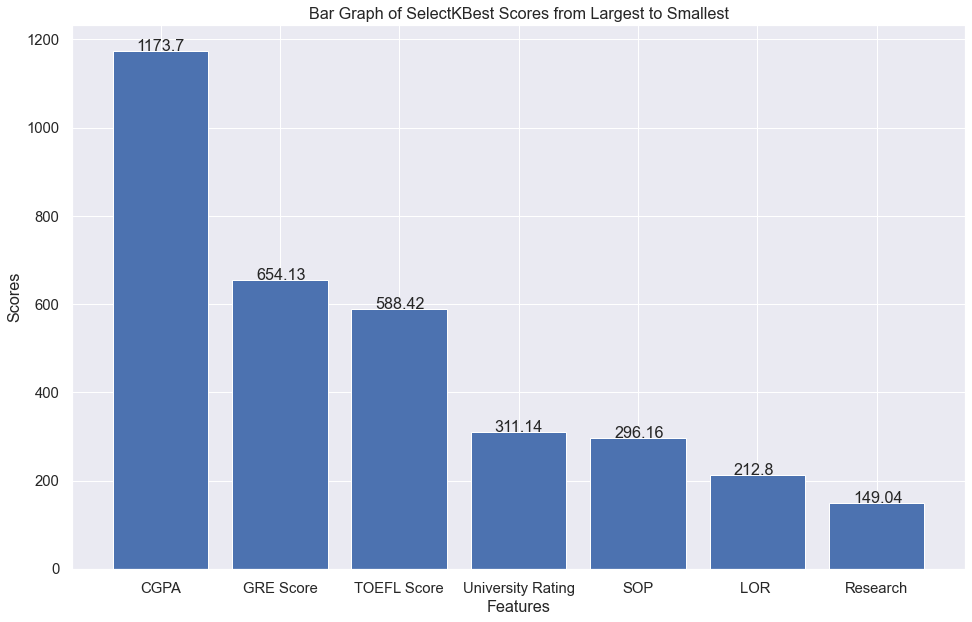
SelectKBest was the other reduction technique I looked at but decided to use PCA instead. Again, there was no real reason for this other than I just wanted to explore using PCA instead.
Tuning Model Hyperparameters #
The python library sklearn has a function that allows you to run your models with a multitude of different parameters to find the best ones for your model. The function in question is GridSearchCV, it makes fine-tuning models and getting the best possible hyperparameters soooo much easier.
GridSearchCV Example #
Below is an excerpt from the linked notebook for this project on what GridSearchCV looks like in practice, in this case using Random Forest.
Model without feature reduction:
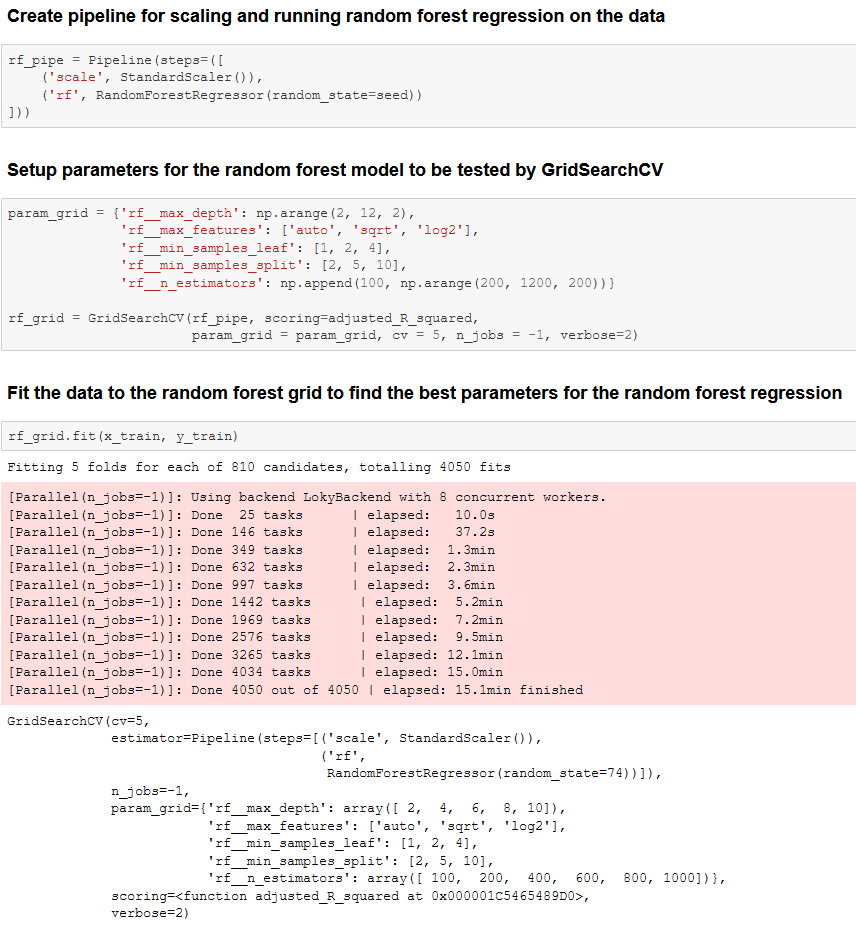
The only change from the example above is the first cell, the pipeline has another line for implementing the PCA feature reduction:
('pca', PCA(n_components=5)),

Results - Random Forest #
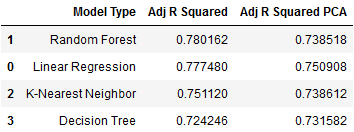
In the end it turned out that the best model was Random Forest without PCA feature reduction, it had an
Adjusted R^2 Score
of 0.7801 and its PCA counterpart had a score of 0.7385.
Best Parameters #
The best parameters for the random forest model was the following:
Best Random Forest Regression Parameters
========================================
               max_depth: 6
            max_features: log2
        min_samples_leaf: 1
       min_samples_split: 5
            n_estimators: 1000
The table above shows that in all model types, except one, PCA feature reduction did not improve the performance of the
model. The only exception being decision tree regression, which did improve slightly (~0.0074) over the decision
tree model without PCA reduction. All the models (except decision tree) had a notable decrease in performance with PCA
reductions, with a performance drop ranging between ~0.0125 and ~0.042 across the three other models.
Thus, it appears that my prediction from before was correct, PCA feature reduction did not really provide any meaningful improvements to the performance results of the models.