Predicting Video Game Sales
Date: 06 Oct 2021 Tag(s): Jupyter Notebook, Python, Pandas, Profiling, Plotly, Models, Video Games Categories: Machine Learning, ML, Regression Download Project: 5.26 MB - Zip ArchiveOverview #
The video game market has only continued to grow over the years and is now spanning all genres. With this growing market the various gaming publishers will want to capitalize on the interests of the various gamers within it and picking the right kind of game to develop and put out into the market could make or break a gaming publisher/studio.
This project compares the performance of several different regression models (Linear Regression, Random Forest, K-Nearest Neighbor (KNN) and Decision Tree) in order to analyze which model performs the best for predicting sales performance over time. For model scoring, the Adjusted R^2 metric will be used to see which model performed the best with the data.
This notebook explores several different types of regression models (see above), in order to find the best model possible that can predict the expected sales performance of a video game.
View Jupyter Notebook #
The notebook goes step-by-step through the project, please follow the directions and cell order if you would like to replicate the results.
- Click the "View Notebook" button to open the rendered notebook in a new tab
- Click the "GitHub" button to view the project in the GitHub portfolio repo
Methodology #
Each regression model type (Linear Regression, Random Forest, K-Nearest Neighbor, and Decision Tree) will be trained and have their
hyperparameters fine-tuned using
GridSearchCV.
Due to the nature of the modeling type, regression, there are a few variables that need to be
OneHotEncoded
in order to be used in the modeling process. After modeling training, their performance will be compared to each using the
Adjusted R^2 metric to see which of the models is the best for making video game predictions.
Exploratory Data Analysis (EDA) #
The following are several graphs were created to get a better idea of the overall structure and distribution of the data in the dataset. This helps to see anything that might need to be accounted for or changed before starting analysis and modeling.
Here is a sample of what the data looks like:

Variable Histograms #
Histograms of the numerical variables to see their overall distributions in the dataset:
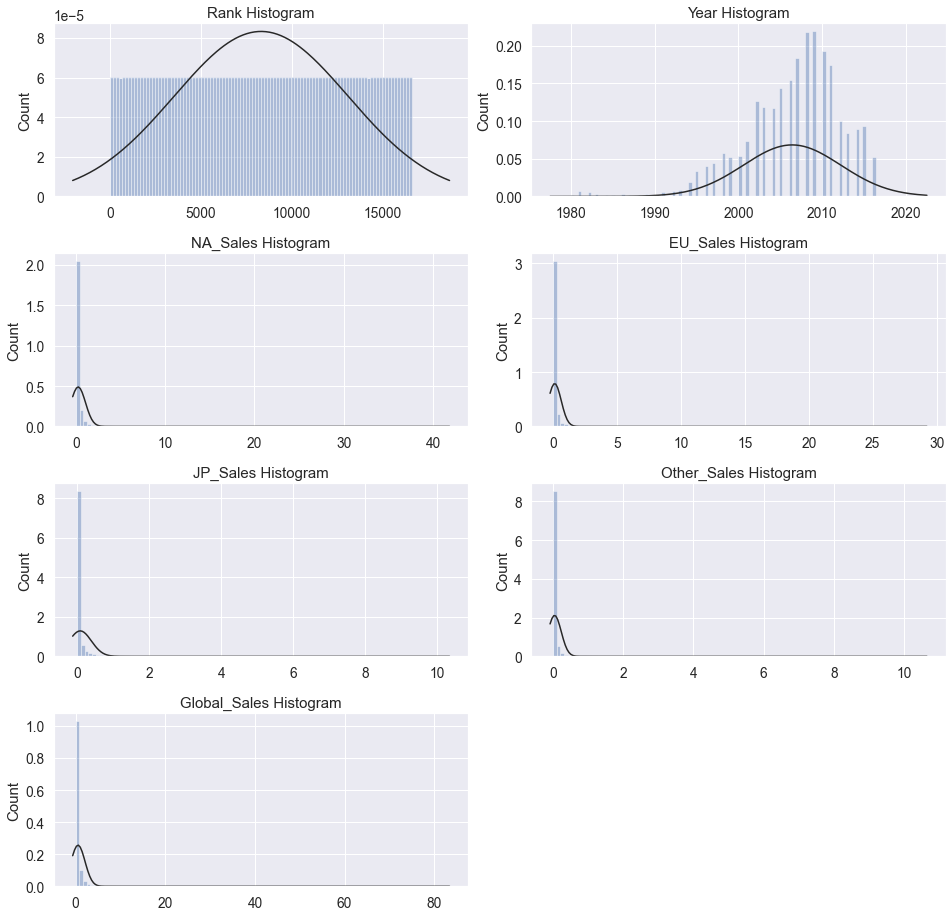
We can see that the rank graph is not useful, it appears to be a column index carryover from when the data was collected.
The year graph shows a normal distribution of collected data and the remaining sales graphs all look the same with minor
count differences.
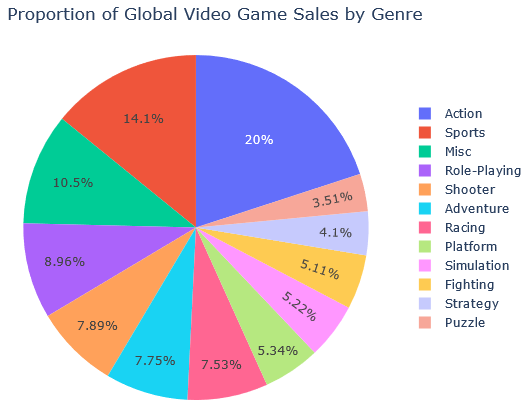
Proportion of Global Video Game Sales by Genre #
The pie chart shows us that action and sports video games are the most popular genres by far:
Top 25 Video Game Sales by Platform and Region #
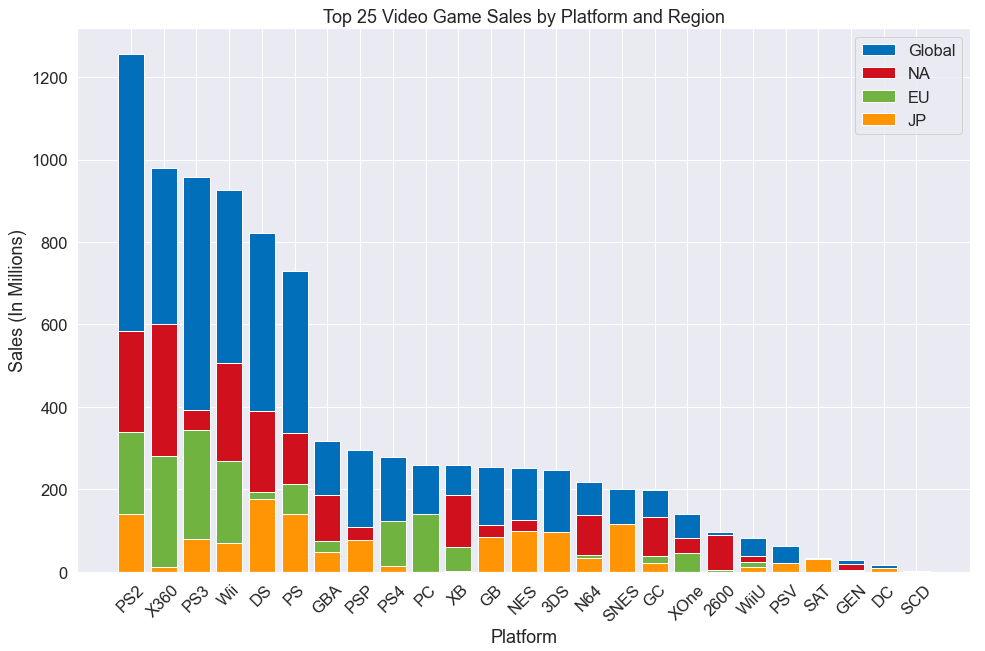
The stacked barchart below makes it clear that there is quite a large gap between the first six platforms and the rest of
them, with an even larger gap between the first one (PS2 - Playstaion 2)
and the second one (X360 - Xbox 360). It is
also worthy to note that of those top six gaming platforms, three of them were created by
Sony: PS2, PS3, and PS.
Top 10 Video Game Publishers by Global Sales Per Year #
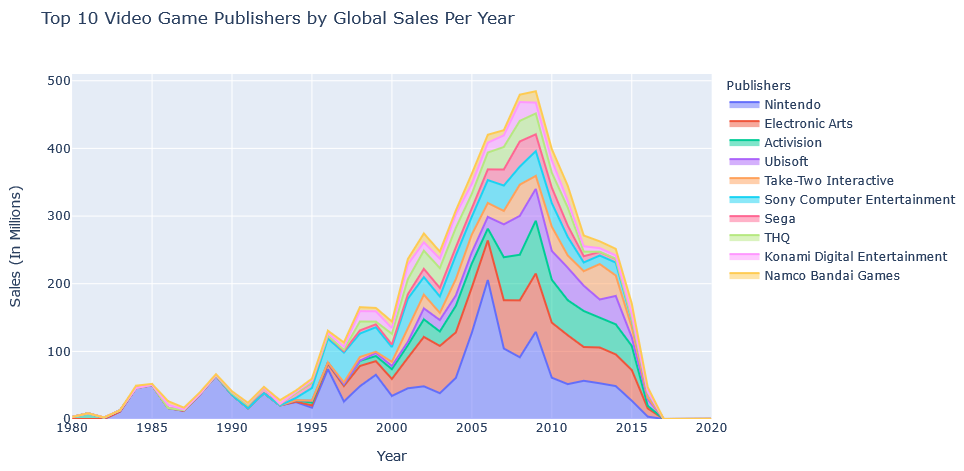
The sales chart below shows that by far Nintendo has continued to be an industry leader (with Electronic Arts being a modest second) in gaming throughout the years all the way back to the initial gaming boom in the 1980s. It is interesting to see that while Sony seems to dominate the console gaming platforms, their share of game sales is far lower than you would be led to believe.
Correlation Matrices #
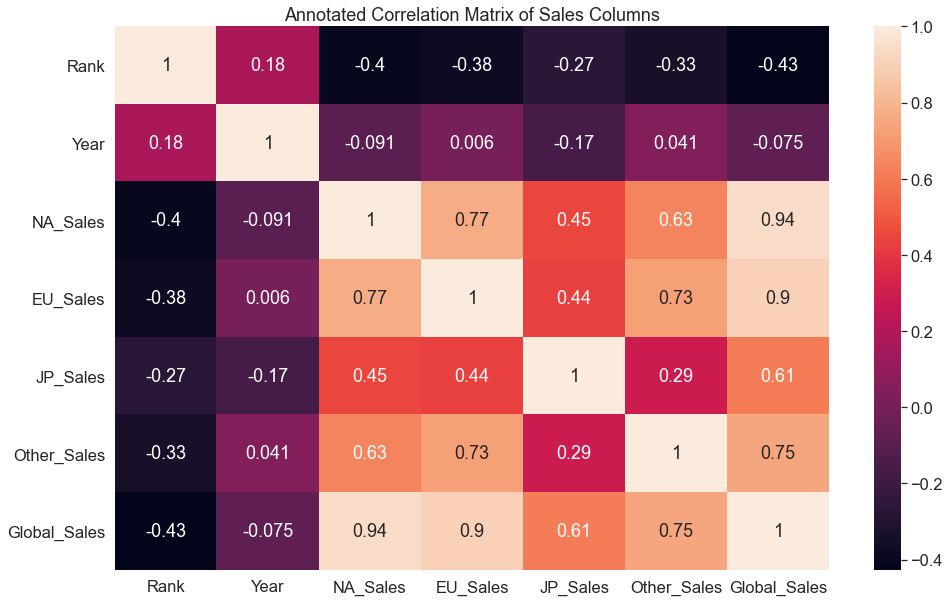
The correlation matrix below shows that both the Rank and Year columns have no significant relationship with any of the
sales columns and thus they can be safely dropped from the dataset.
Due to the number of categorical values in each of the categorical columns (Genre, Platform and Publisher) and the
massive increase in modeling time that be caused by OneHotEncoded
all of them, the only column that could be encoded and utilized in the data is the Genre column. This is mainly due to
the fact that there were not that many different genres in the dataset (12 genres, compared to 587 different publishers and 30 different platforms).
Thus, below is what the final dataset looks like (via correlation matrix), the following columns were dropped in the
process: Rank, Name, Year, Publisher, and Platform.
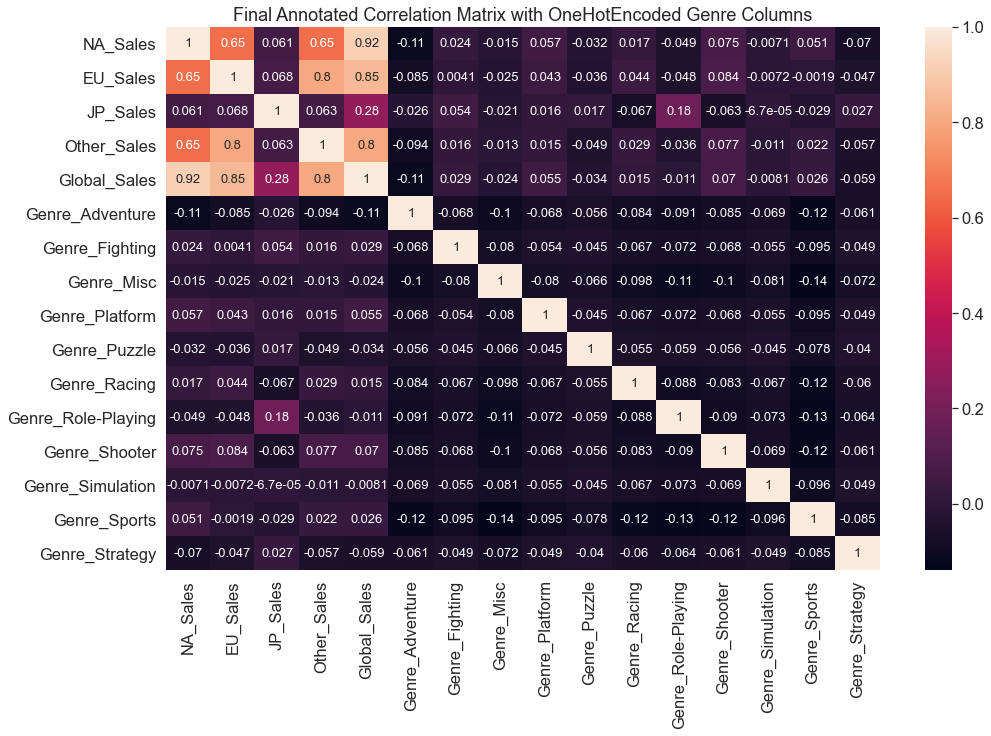
NOTE: While all of the genre’s have very low correlations with the sales regions, the
Role-Playinggenre has a noticeably higher correlation withJP (Japan) Sales(0.18) than other genre’s and regions.
Tuning Model Hyperparameters #
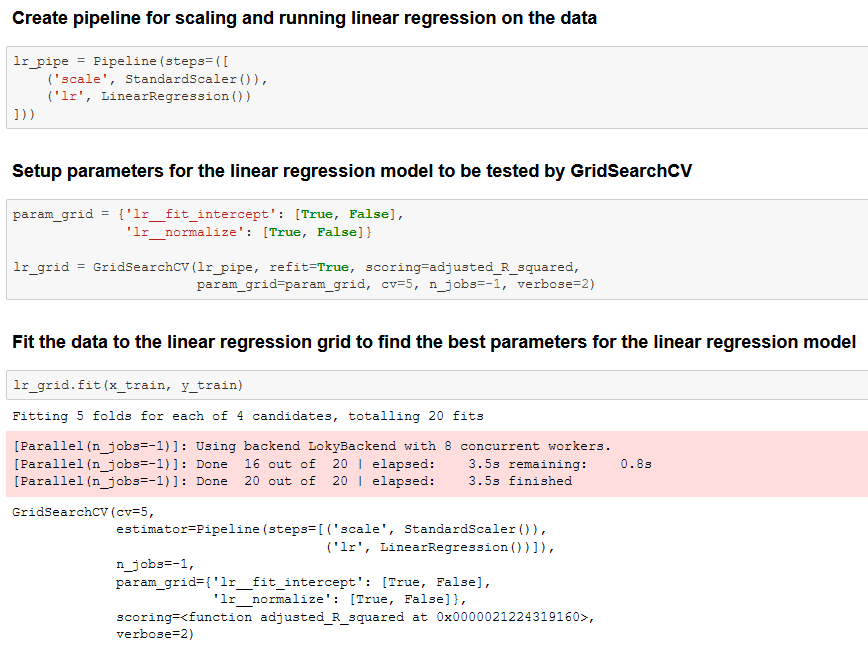
The python library sklearn has a function that allows you to run your models with a multitude of different parameters to find the best ones for your model. The function in question is GridSearchCV, it makes fine-tuning models and getting the best possible hyperparameters soooo much easier.
GridSearchCV Example #
Below is an excerpt from the linked notebook for this project on what GridSearchCV looks like in practice, in this case using Linear Regression (not many parameters to tune).
Results - Linear Regression #
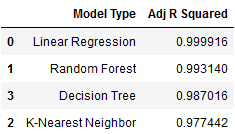
After training all the models, Linear Regression is the model that came out on top with an
Adjusted R^2
score of ~0.9999. However, all of the models performed very well and they ended up with scores that were 0.95+:
With the following parameters:
Best Linear Regression Parameters
=================================
      fit_intercept: True
          normalize: True
Conclusion #
Based on the analysis and experimentation, I am confident that the selected final model is the best performing model for utilization in making predictions on future video game sales. I would say that the model could be improved by also utilizing the other columns that needed to be encoded (platform and publisher) but due to the limitations of my current hardware, modeling would simply take too long than would be feasible.
I would also recommend that using some kind of feature reduction method (PCA, SelectKBest, etc..) could also help in reducing the number of features and the length of modeling time at the cost of a small loss in scoring.